
Australia’s prestige property market is no longer anchored to its traditional strongholds.
Once dominated by Sydney and Melbourne, the luxury market is now expanding across multiple fronts, with Perth and South East Queensland leading a new wave of decentralised growth, according to Ray White economist Atom Go Tian.
To track that shift at a granular level, Mr Go Tian analysed data from the Australian Bureau of Statistics at SA2* level, allowing for suburb by suburb comparisons across the country’s top performing prestige markets.
The result is a picture of a housing landscape moving at several different speeds, with each city at a different stage of the cycle.
Mr Go Tian defines luxury as the top five per cent of the market, measured by sales and median price. Nationally, that threshold now sits around $2.7 million, up from about $1.5 million a decade ago. However, he explains that luxury is also highly localised.
“In Sydney, luxury is closer to $4.7 million,” he said. “If you used the national figure, you would include suburbs that aren’t really considered prestige in that market.”
At the centre of the shift is Perth, where high-end suburbs are delivering some of the strongest gains in the country.
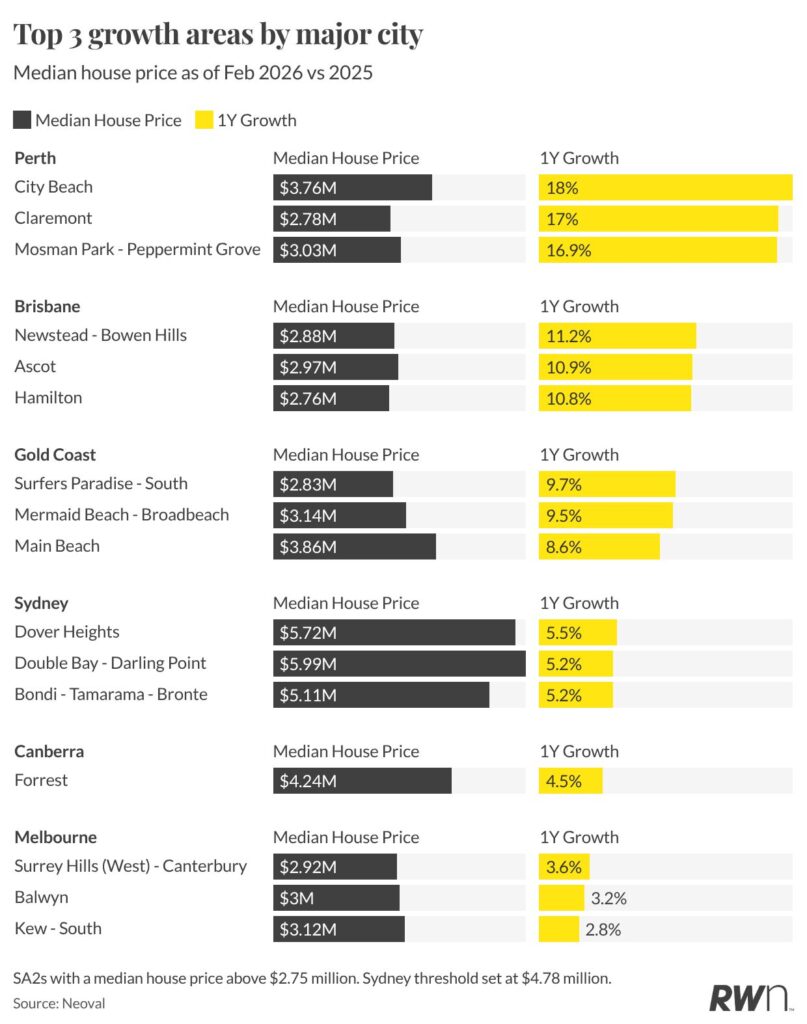
Areas like City Beach have surged by as much as 18 per cent over the past year, a remarkable figure for markets already sitting above $3 million. According to Mr Go Tian, this is no short term spike.
“Perth’s most expensive areas growing at 16 to 18 per cent, that’s massive growth for suburbs at that price point,” he said.
The strength is broad based rather than isolated, with multiple prestige suburbs rising in tandem; it marks Perth’s third consecutive year of double digit luxury growth, driven by tight supply, population inflows and a strengthening local economy.
The result is a narrowing gap between Perth and Sydney, with buyers increasingly willing to compete and pay for what was once considered relative value.
Queensland is following closely behind, with Brisbane and the Gold Coast showing similar patterns of widespread uplift.
High end pockets across Brisbane, including Newstead–Bowen Hills and Ascot, are posting annual growth of around 11 per cent, while coastal prestige markets like Main Beach are approaching $4 million medians.
“The pattern mirrors what Perth was doing twelve months ago,” Mr Go Tian said. “It suggests Queensland is entering its most intensive growth phase.”
By contrast, Sydney, still the country’s most expensive luxury market, is growing at a more measured pace.
Prestige suburbs such as Dover Heights and Double Bay are recording gains of around 5 per cent. While modest in percentage terms, the dollar increases remain substantial, often adding more than $300,000 in value over a year.
“Sydney isn’t weakening, it’s consolidating … It’s holding at a level that still commands a significant premium.”
Melbourne, meanwhile, is showing early signs of recovery after a period of underperformance. Growth has returned to key luxury suburbs, but at a slower pace than any other major city. According to Mr Go Tian, this reflects a broader national rebalancing.
“The surprising thing is that Sydney, Canberra and Melbourne are now at the bottom of the growth rankings,” he said. “Luxury is becoming more decentralised, it’s no longer just Sydney and Melbourne.”
That shift is being fuelled by a new generation of buyers. Where prestige property was once dominated by corporate executives and generational wealth tied to specific cities, today’s luxury purchasers are increasingly self made and geographically flexible.
“We’re seeing more founders in tech, finance and retail,” he said. “They’re not bound to one location anymore, they’re looking at lifestyle and capital growth opportunities across the country.”
Even smaller markets are reflecting the trend. In Canberra, just one suburb, Forrest, meets the luxury threshold, highlighting how tightly held and supply constrained the top end remains.
Looking ahead, the pace of growth is expected to moderate. After a strong run fuelled in part by interest rate cuts in 2025, rising rates and global uncertainty are likely to temper conditions.
“We’re not expecting the same level of growth this year,” Mr Go Tian said. “But we’re also not expecting a decline. The momentum, particularly in Perth and Queensland, is still there.”
*SA2 (Statistical Area Level 2)
SA2 is a geographic classification used by the Australian Bureau of Statistics (ABS) to group suburbs and local neighbourhoods for statistical reporting. Each SA2 typically represents a community of around 3,000 to 25,000 people and is used to provide detailed local-level data that sits below broader city and regional averages.