
Australia’s housing supply appears close to keeping pace with population growth at a national level, but state-by-state figures reveal a much more uneven picture, with Western Australia and Queensland facing the greatest supply pressure, according to Ray White Group Chief Economist Nerida Conisbee.
Drawing on the latest Australian Bureau of Statistics population data and dwelling completion figures, Conisbee says the relationship between population growth and housing delivery is becoming increasingly clear.
“Housing supply is not a side issue in affordability. It is the issue,” she said.
“Prices can move for many reasons – interest rates, incomes, tax settings and confidence all play a role – but if population growth keeps running ahead of new housing delivery, affordability deteriorates.”
The latest ABS population figures, released last week, show how many people were added in each state and territory over the year to December 2025.
These can be compared with the ABS Building Activity release, published in April, which shows how many new dwellings were completed over the 2025 calendar year.
“The result is a simple but powerful measure: how many additional people were added for every new home completed,” Ms Conisbee said.
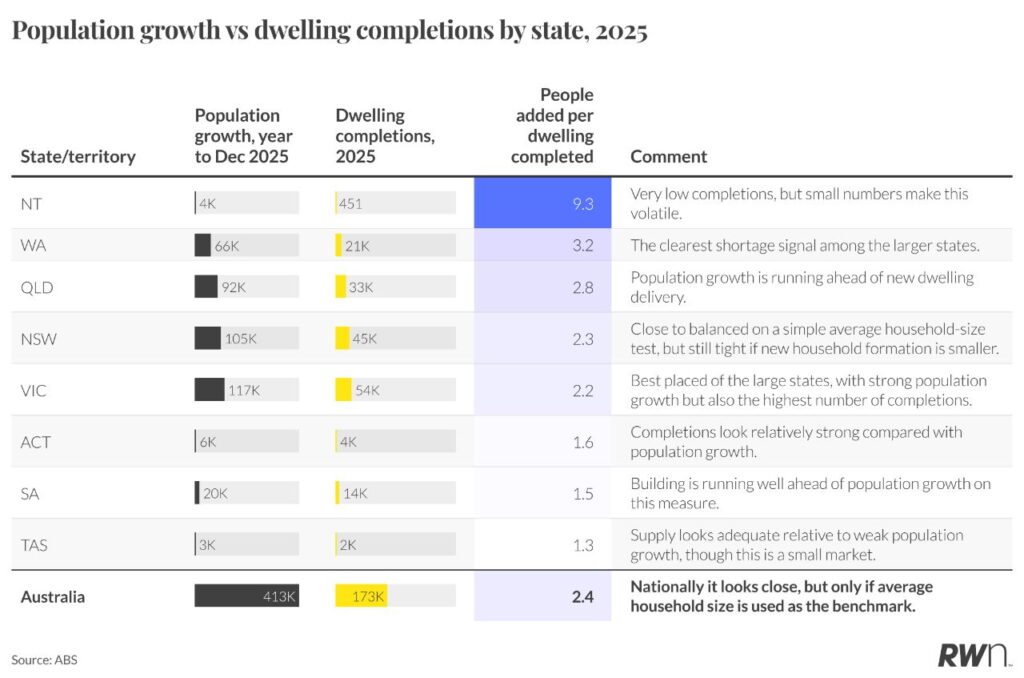
Nationally, Australia added 412,500 people during the year while 172,794 dwellings were completed, equating to 2.4 additional people for every new home.
“Given Australia’s average household size was around 2.5 people at the last Census, it is easy to see why some argue that housing delivery is broadly keeping up with population growth,” she said.
However, relying on the national average household size risks understating the true level of housing demand.
“That conclusion relies heavily on one assumption: that average household size is still 2.5 people, and that this is the right number to use. Neither is certain.”
“What we do know is that household size has been falling over time, reflecting smaller families, more people living alone, an ageing population and changing living arrangements.”
Ms Conisbee said the average household size of the existing population may not reflect the people currently driving housing demand.
“More importantly, average household size describes the existing population, not the people currently driving population growth.”
“Growth is still heavily migration-led, and new arrivals are more likely to be students, younger workers and renters than established family households. That means the relevant household size for new demand is likely to be lower than 2.5.”
She said the implications are significant.
“At 2.5 people per household, 412,500 additional people require around 165,000 homes. At 2.2, the requirement rises to around 187,500 homes. At 2.0, it rises to more than 206,000 homes.”
“On that basis, Australia is not comfortably building enough.”
The state-by-state data shows the greatest imbalance between population growth and housing delivery is in Western Australia and Queensland.
“The clearest pressure points are Western Australia and Queensland.”
Western Australia added around 65,500 people over the year but completed just 20,597 dwellings, equating to 3.2 additional people for every new home completed. Queensland added 92,200 people and completed 32,912 dwellings, or 2.8 people per new dwelling. Both states sit above the national average of 2.4 people per completed home.
She said the relationship between supply and price growth was difficult to ignore.
“The link with price growth is hard to miss.”
Cotality data shows house prices increased 25.2 per cent over the year in Western Australia and 17.0 per cent in Queensland, among the strongest annual gains nationally.
“These are among the strongest results in the country and sit alongside the clearest evidence of population growth running ahead of new housing delivery.”
“Supply is not the only driver of price growth, but where supply is clearly not keeping pace, the pressure on prices and rents becomes far more difficult to contain.”
Victoria presented a markedly different picture.
The state recorded Australia’s largest population increase, adding 117,300 people, while also completing the highest number of dwellings at 54,221. That equated to 2.2 additional people for every new home completed.
The ACT also recorded one of the strongest supply outcomes, with 1.6 additional people per completed dwelling, while NSW added 104,600 people and completed 45,145 homes, or 2.3 people per dwelling.
“The ACT also looks strong, with 1.6 people added per new dwelling, while NSW performed better than might be expected.
“Sydney still has serious affordability and rental challenges, but on this measure, NSW is much closer to keeping pace than Queensland or Western Australia.”
Where housing delivery has been stronger, price growth has been more subdued.
“Victoria is the clearest example. Despite adding the most people of any state, it completed enough homes to keep the ratio of new people to new dwellings down to 2.2.”
Cotality data shows Victorian house prices rose just 2.0 per cent over the year, compared with 17.0 per cent in Queensland and 25.2 per cent in Western Australia. Canberra recorded annual house price growth of 5.2 per cent.
“Other factors have also weighed on Victoria and Canberra, including weaker investor demand, affordability limits and softer sentiment.”
“But supply is the main point of difference. Where new housing delivery is closer to population growth, price pressure is calmer. Where population growth is running well ahead of completions, prices and rents are doing exactly what should be expected.”