
Australian home prices have fallen for the third consecutive month as higher interest rates and cost-of-living pressures severely chip away at buyer purchasing power.
The latest PropTrack Home Price Index for June 2026 reveals a distinct property cooldown, with national home prices slipping 0.3% over the month.
The decline pushes national values 0.9% below their March peak, though property values still remain 5.8% higher than they were this time last year, keeping the national median at $903,000.
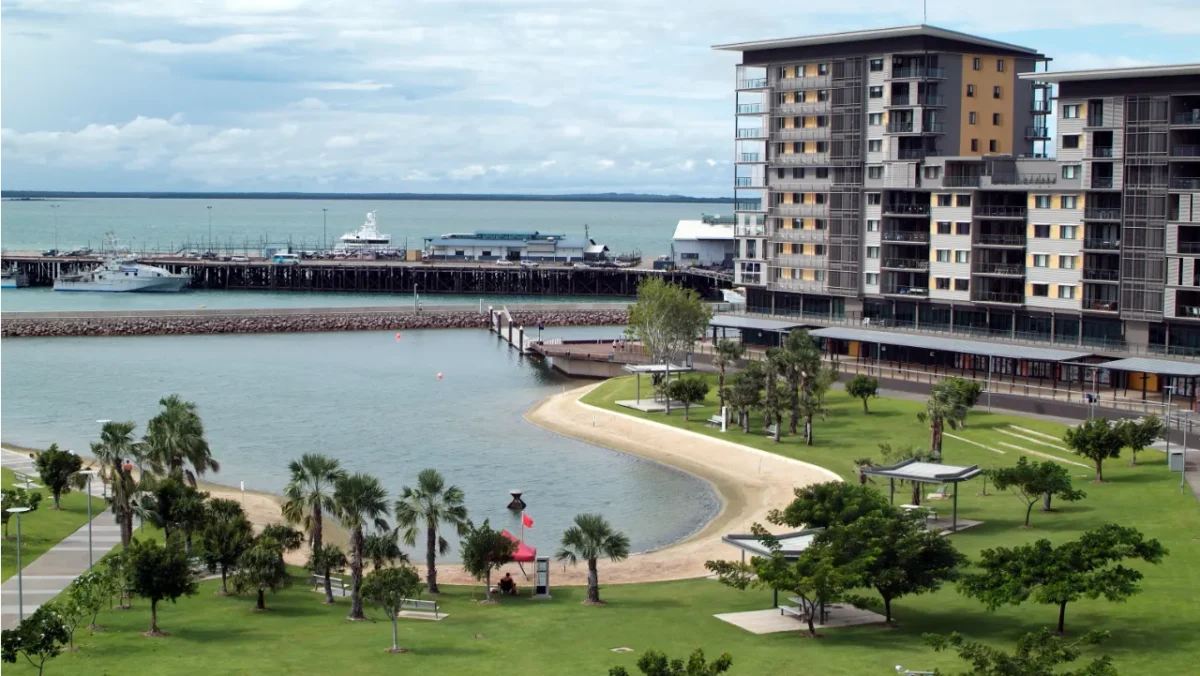
In a sweeping downturn that impacted almost every major metro area, Darwin emerged as the sole capital city to defy the slump.
Darwin home prices bucked the trend by lifting 0.2% in June , bringing its annual growth to a staggering 16.7%, making it the second-strongest yearly performer in the country behind Perth.
Capital cities lead the slide
The monthly downturn was heavily driven by the capital cities, which saw an overall dip of 0.4% in June.
Sydney and Perth bore the brunt of the monthly correction, both recording the sharpest declines at -0.5%.
They were closely followed by Melbourne and Canberra, which both slid by 0.4%. More modest monthly drops were recorded in Brisbane (-0.2%), Adelaide (-0.2%), and Hobart (-0.2%).
Despite the June correction, the longer-term data highlights a starkly divided market across Australia’s capitals:
- Melbourne stands alone as the only capital city where the median home price is lower compared to a year ago , down 1.1% over the past 12 months to a median of $839,000. It remains 3.1% below its historic peak.
- Perth continues to boast explosive long-term numbers despite its monthly dip, with annual growth sitting at 17.1% and an astronomical 5-year growth rate of 96.2% , bringing its median to $1,010,000.
- Brisbane ($1,073,000 median) and Adelaide ($942,000 median) also maintained exceptionally strong annual gains of 13.9% and 11.9% respectively , backed by massive 5-year growth spurts of 84.6% and 81.2%.
- Sydney remains the nation’s most expensive capital with a median value of $1,225,000 , sitting 2.5% below its peak after a flat year of just 0.5% annual growth.
Regionals and units hold firm at peaks
While city buyers pulled back, regional markets continued to exhibit remarkable resilience, completely holding steady over June.
Home values remained at record highs in every single regional area except Queensland. Regional South Australia and Regional Tasmania both managed to grow by 0.3% over the month, while Regional NSW ticked up 0.1%.
Regional Victoria, Regional WA, and Regional NT all recorded a flat 0.0% change. The combined regional median now sits 9.5% higher than a year ago at $723,000, driven by immense 5-year gains led by Regional WA (+98.7%) and Regional SA (+94.4%).
Property types also saw a clear divergence. Nationally, unit prices held perfectly flat (0%) over June, outperforming houses, which slipped downward by 0.4%.
Economist: affordability and the budget driving the market
PropTrack Senior Economist Anne Flaherty said that compounding financial pressures and recent government policy are forcing a shift in buyer behaviour.
“Home prices softened across every capital city in June, bar Darwin, as higher interest rates and cost of living pressures continue to weigh on purchasing power. The Budget may have also contributed to more cautious decision making among both owner occupying buyers and investors.”

She highlighted that the sub-markets holding up best are those aligned with shrinking buyer budgets.
“The strongest performing parts of the market continue to be those offering the greatest affordability. Regional markets outperformed capitals over both the month and the year. Similarly, units have recorded smaller declines over the month compared to houses, and have seen stronger growth over the year.”
Looking forward to the remainder of 2026, Ms Flaherty expects budget-conscious options to dictate market movements, offering a rare silver lining for those trying to get a foot in the door.
“Looking ahead, affordability is likely to remain a key driver of market performance, with the share of buyers looking to purchase in more affordable areas, such as regional markets, expected to increase. As yet, the full impact of the Budget on investor demand remains to be seen.
“Overall, conditions appear to have improved for first-home buyers, who will benefit from lower home prices and less investor competition in 2026.”
June 2026 Home Price Index Comprehensive Data
| Region | Monthly Growth | Annual Growth | Change from Peak | 5-Year Growth | Median Value |
| Sydney | -0.5% | 0.5% | -2.5% | 17.9% | $1,225,000 |
| Melbourne | -0.4% | -1.1% | -3.1% | 4.5% | $839,000 |
| Brisbane | -0.2% | 13.9% | -0.4% | 84.6% | $1,073,000 |
| Adelaide | -0.2% | 11.9% | -0.2% | 81.2% | $942,000 |
| Perth | -0.5% | 17.1% | -1.2% | 96.2% | $1,010,000 |
| Hobart | -0.2% | 9.4% | -0.2% | 16.5% | $732,000 |
| Darwin | 0.2% | 16.7% | At peak | 35.1% | $635,000 |
| Canberra | -0.4% | 0.8% | -1.9% | 11.7% | $858,000 |
| Capital Cities | -0.4% | 4.5% | -1.3% | 30.0% | $1,005,000 |
| Regional NSW | 0.1% | 7.3% | At peak | 32.0% | $787,000 |
| Regional Vic | 0.0% | 6.0% | At peak | 21.3% | $606,000 |
| Regional Qld | -0.1% | 11.5% | -0.1% | 77.9% | $831,000 |
| Regional SA | 0.3% | 12.7% | At peak | 94.4% | $522,000 |
| Regional WA | 0.0% | 16.9% | At peak | 98.7% | $671,000 |
| Regional Tas | 0.3% | 13.6% | At peak | 44.8% | $589,000 |
| Regional NT | 0.0% | 2.7% | At peak | 6.2% | $360,000 |
| Regional Areas | 0.0% | 9.5% | At peak | 49.4% | $723,000 |
| National | -0.3% | 5.8% | -0.9% | 34.6% | $903,000 |
(Source: PropTrack Home Price Index June 2026)